Sky Palette Project: 2. Sky Images are Different
Posted on:2023-08-20
Category: Computer Graphics, Machine Learning
This post is a continuation of the Sky Palette Project 1.
PCA Decomposition of the sky image
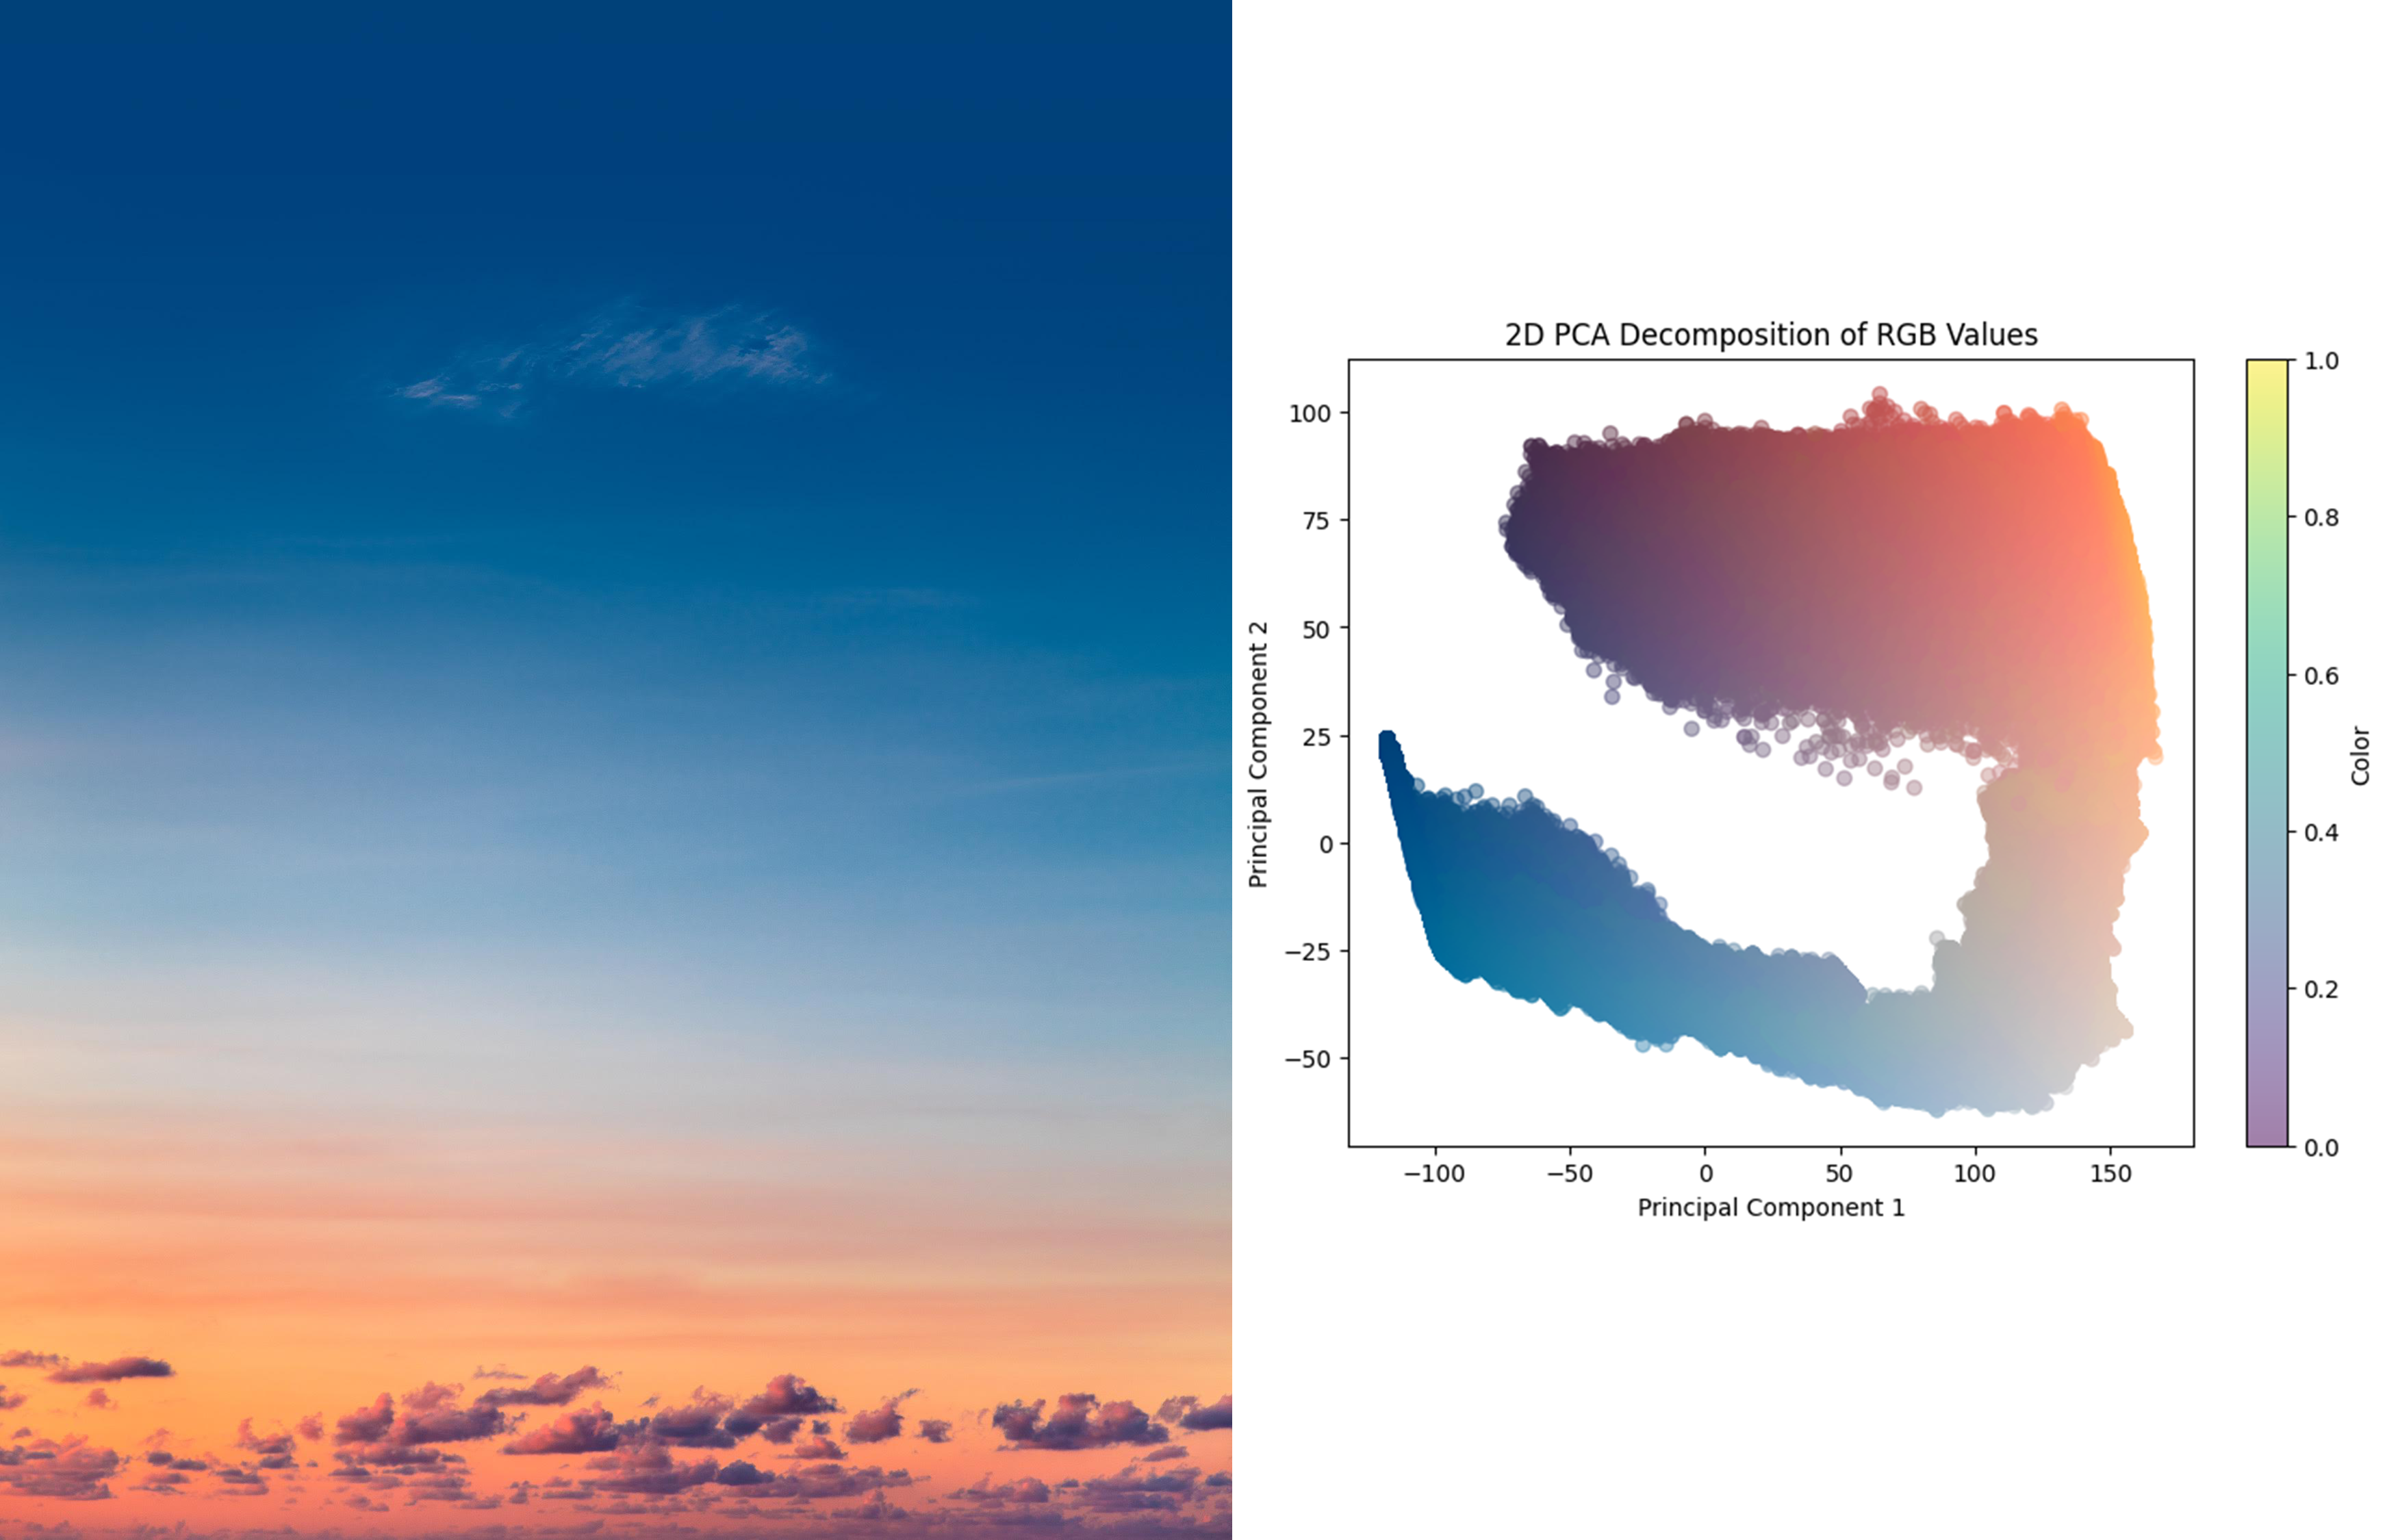
Continuing where I took off last night, I started to go deeper into the analysis methods for the sky image. Last time, I tried with K-means clustering. However, since K-means clustering was simple average of the pixel rgb colors, I thought it was not the best way to capture the expressiveness of the sky image.
I first started with analyzing the PCA components of the image. They returned some interesting results, where I could see a beautiful gradient of the sky image. I wanted to extract those very colors that could make the gradient.
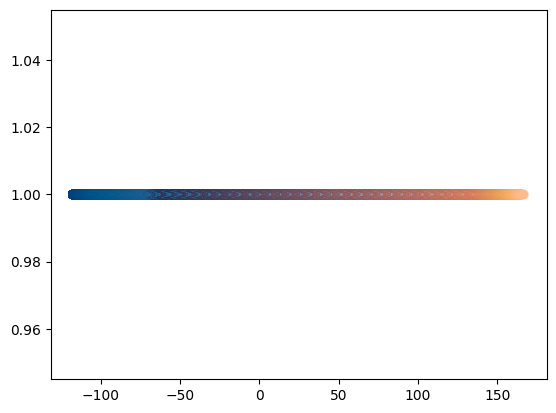
I tried to express the colors in one dimension too. They were not as beautiful as the 2D PCA, but I could see some gradient in the colors. I thought that if I could extract the colors in the gradient, I could make a beautiful palette.

I did make a 5 color palette from the pca components. The colors seemed to represent the important colors in the sky image, however, there was a slight lack in perfection. For this particular sky image, I especially liked the red and purple gradient part, but this palette did not capture that part. However, according to the PCA analysis of the colors, the purple color and the blue color were considered to be very similar. Thus, it was difficult to capture both the dark blue and dark purple colors in the palette.
SNIC segmentation of the sky image
After much contemplation, I decided to try with another method. While I was staring at some sky images, I discovered that sky images had a positional difference in the colors. Since the sky image is basically a gradient, the colors in the sky image are different depending on the position of the image. I thought that if I could capture the positional difference, I could make a better palette.

I started segmenting the sky image with a SLIC algorithm. The SLIC algorithm is a superpixel segmentation algorithm that segments the image into regions of similar colors. I thought that if I could segment the sky image into regions of similar colors, I could capture the positional difference in the sky image. I used the SLIC algorithm from the scikit-image library.
After segmenting the image, I extracted the colors from each segment. However, during the process, I came across with a question. "What if the sky image is not vertically aligned?" I thought that if the sky image was not vertically aligned, the colors would be different depending on the position of the image. Thus, I started to find ways to align the sky image vertically.
Image Rotation with LAB Deconstruction
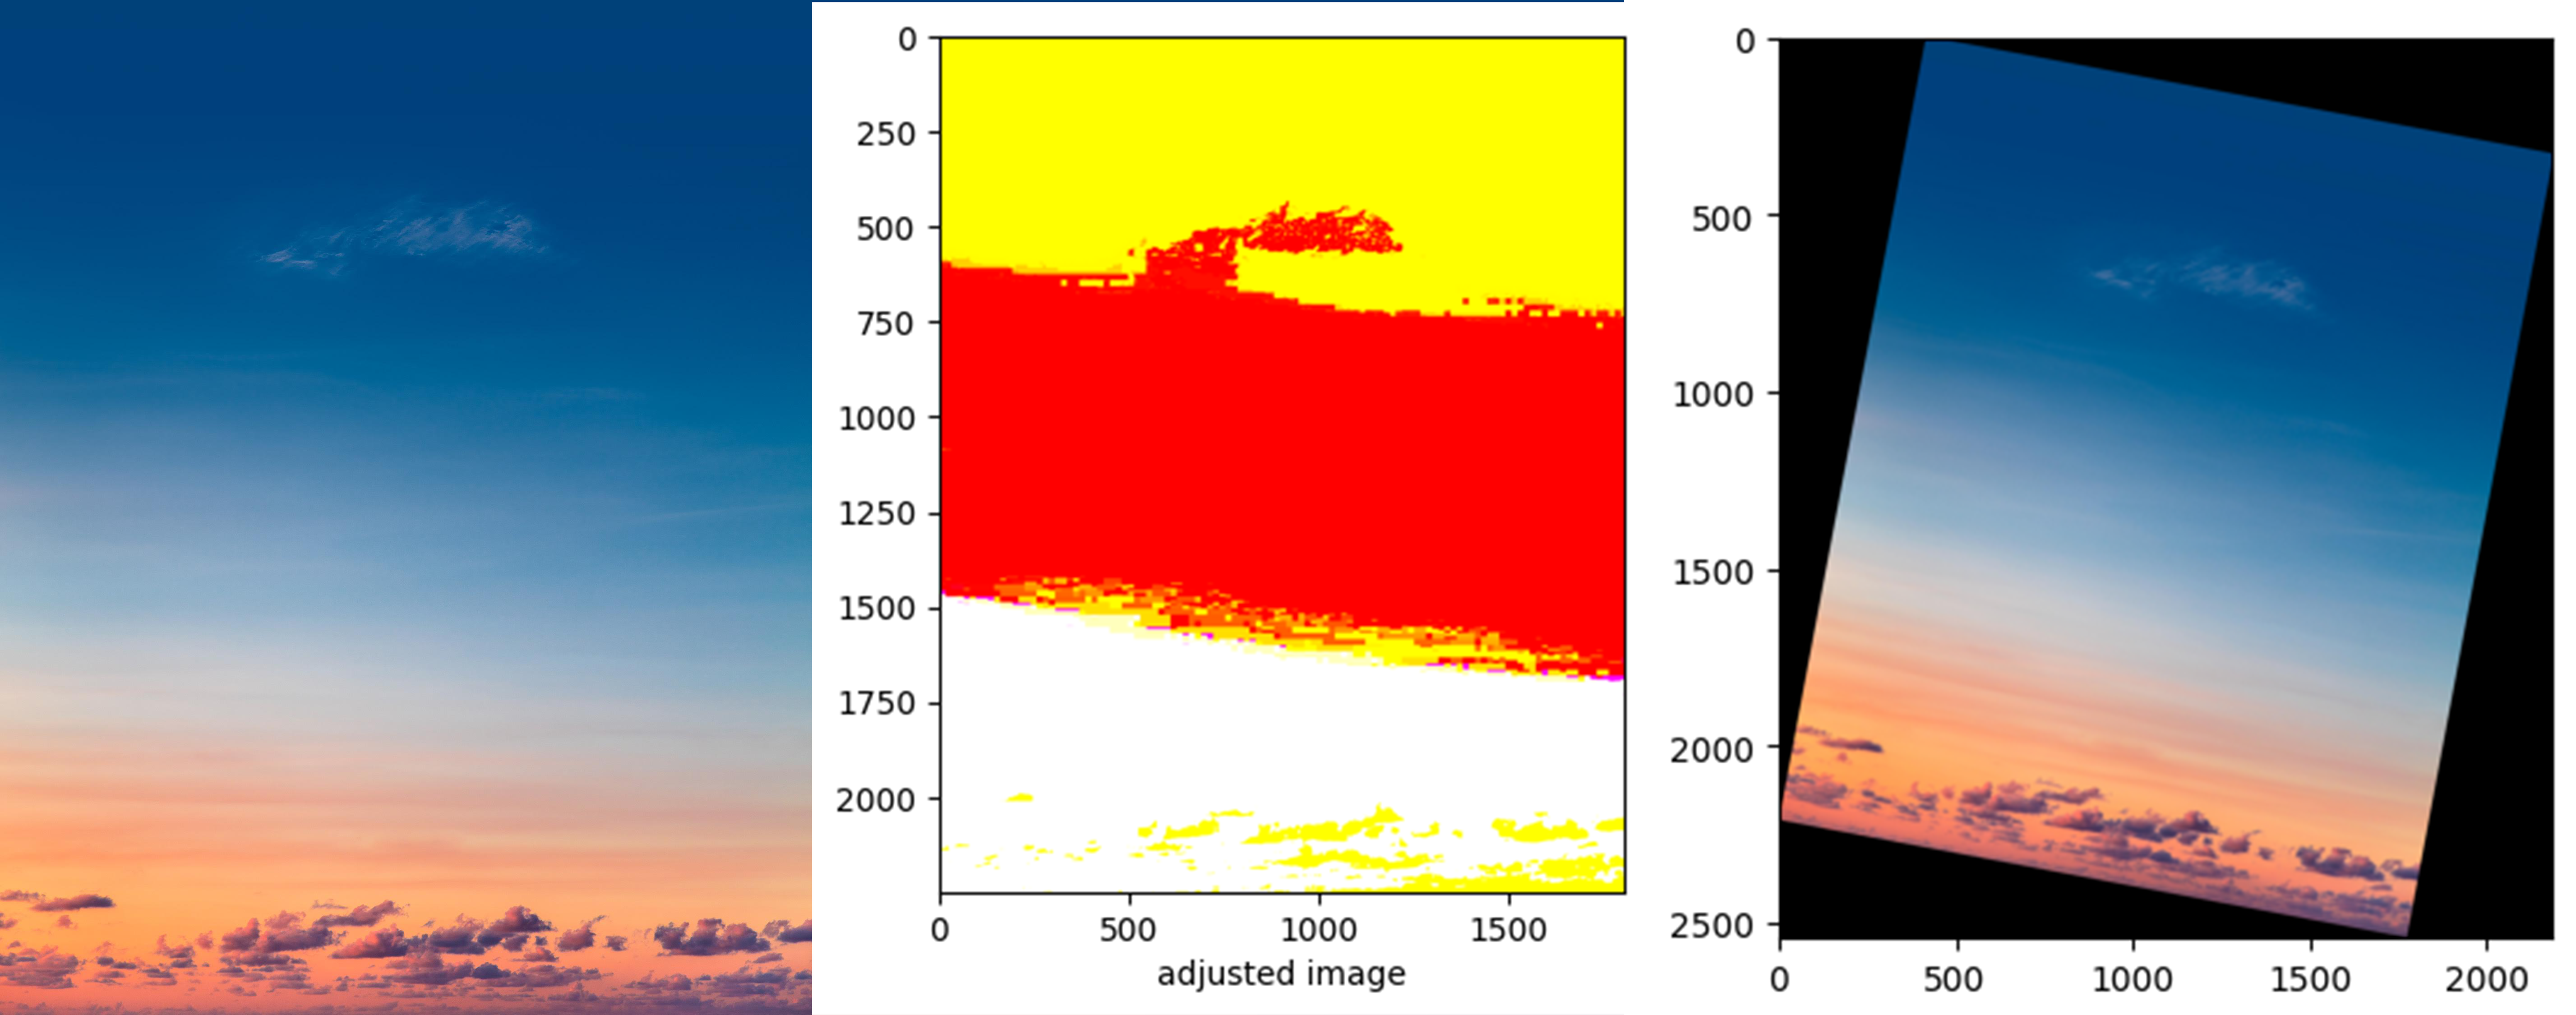
After much research, I found that LAB deconstruction is best for differentiating colors. So I first changed the rgb image into a lab image. After the deconstruction, I found that there were clear distinctions in color areas. Using a convolutional neural network, I calculated the gradients of each pixels. Then, I calculated the mean of the gradients to find the best rotation angle.
The rotation seemed to work. However, I soon found out that this was not applicable to all sky images. The biggest problem occurred when there were clouds. Since LAB takes lightness into its consideration, the clouds had a clear distinction with the atmosphere background color. Thus the rotation angle did not seem to work when there were many clouds. Thus I decided to forgo the attempt to align the sky image.
I started to go deeper into color segmentation using SNIC. Assuming that the sky image has a vertical color gradient, I grouped the segments according to the vertical position of the segment. Then, I extracted the colors from each group.
Result Comparison
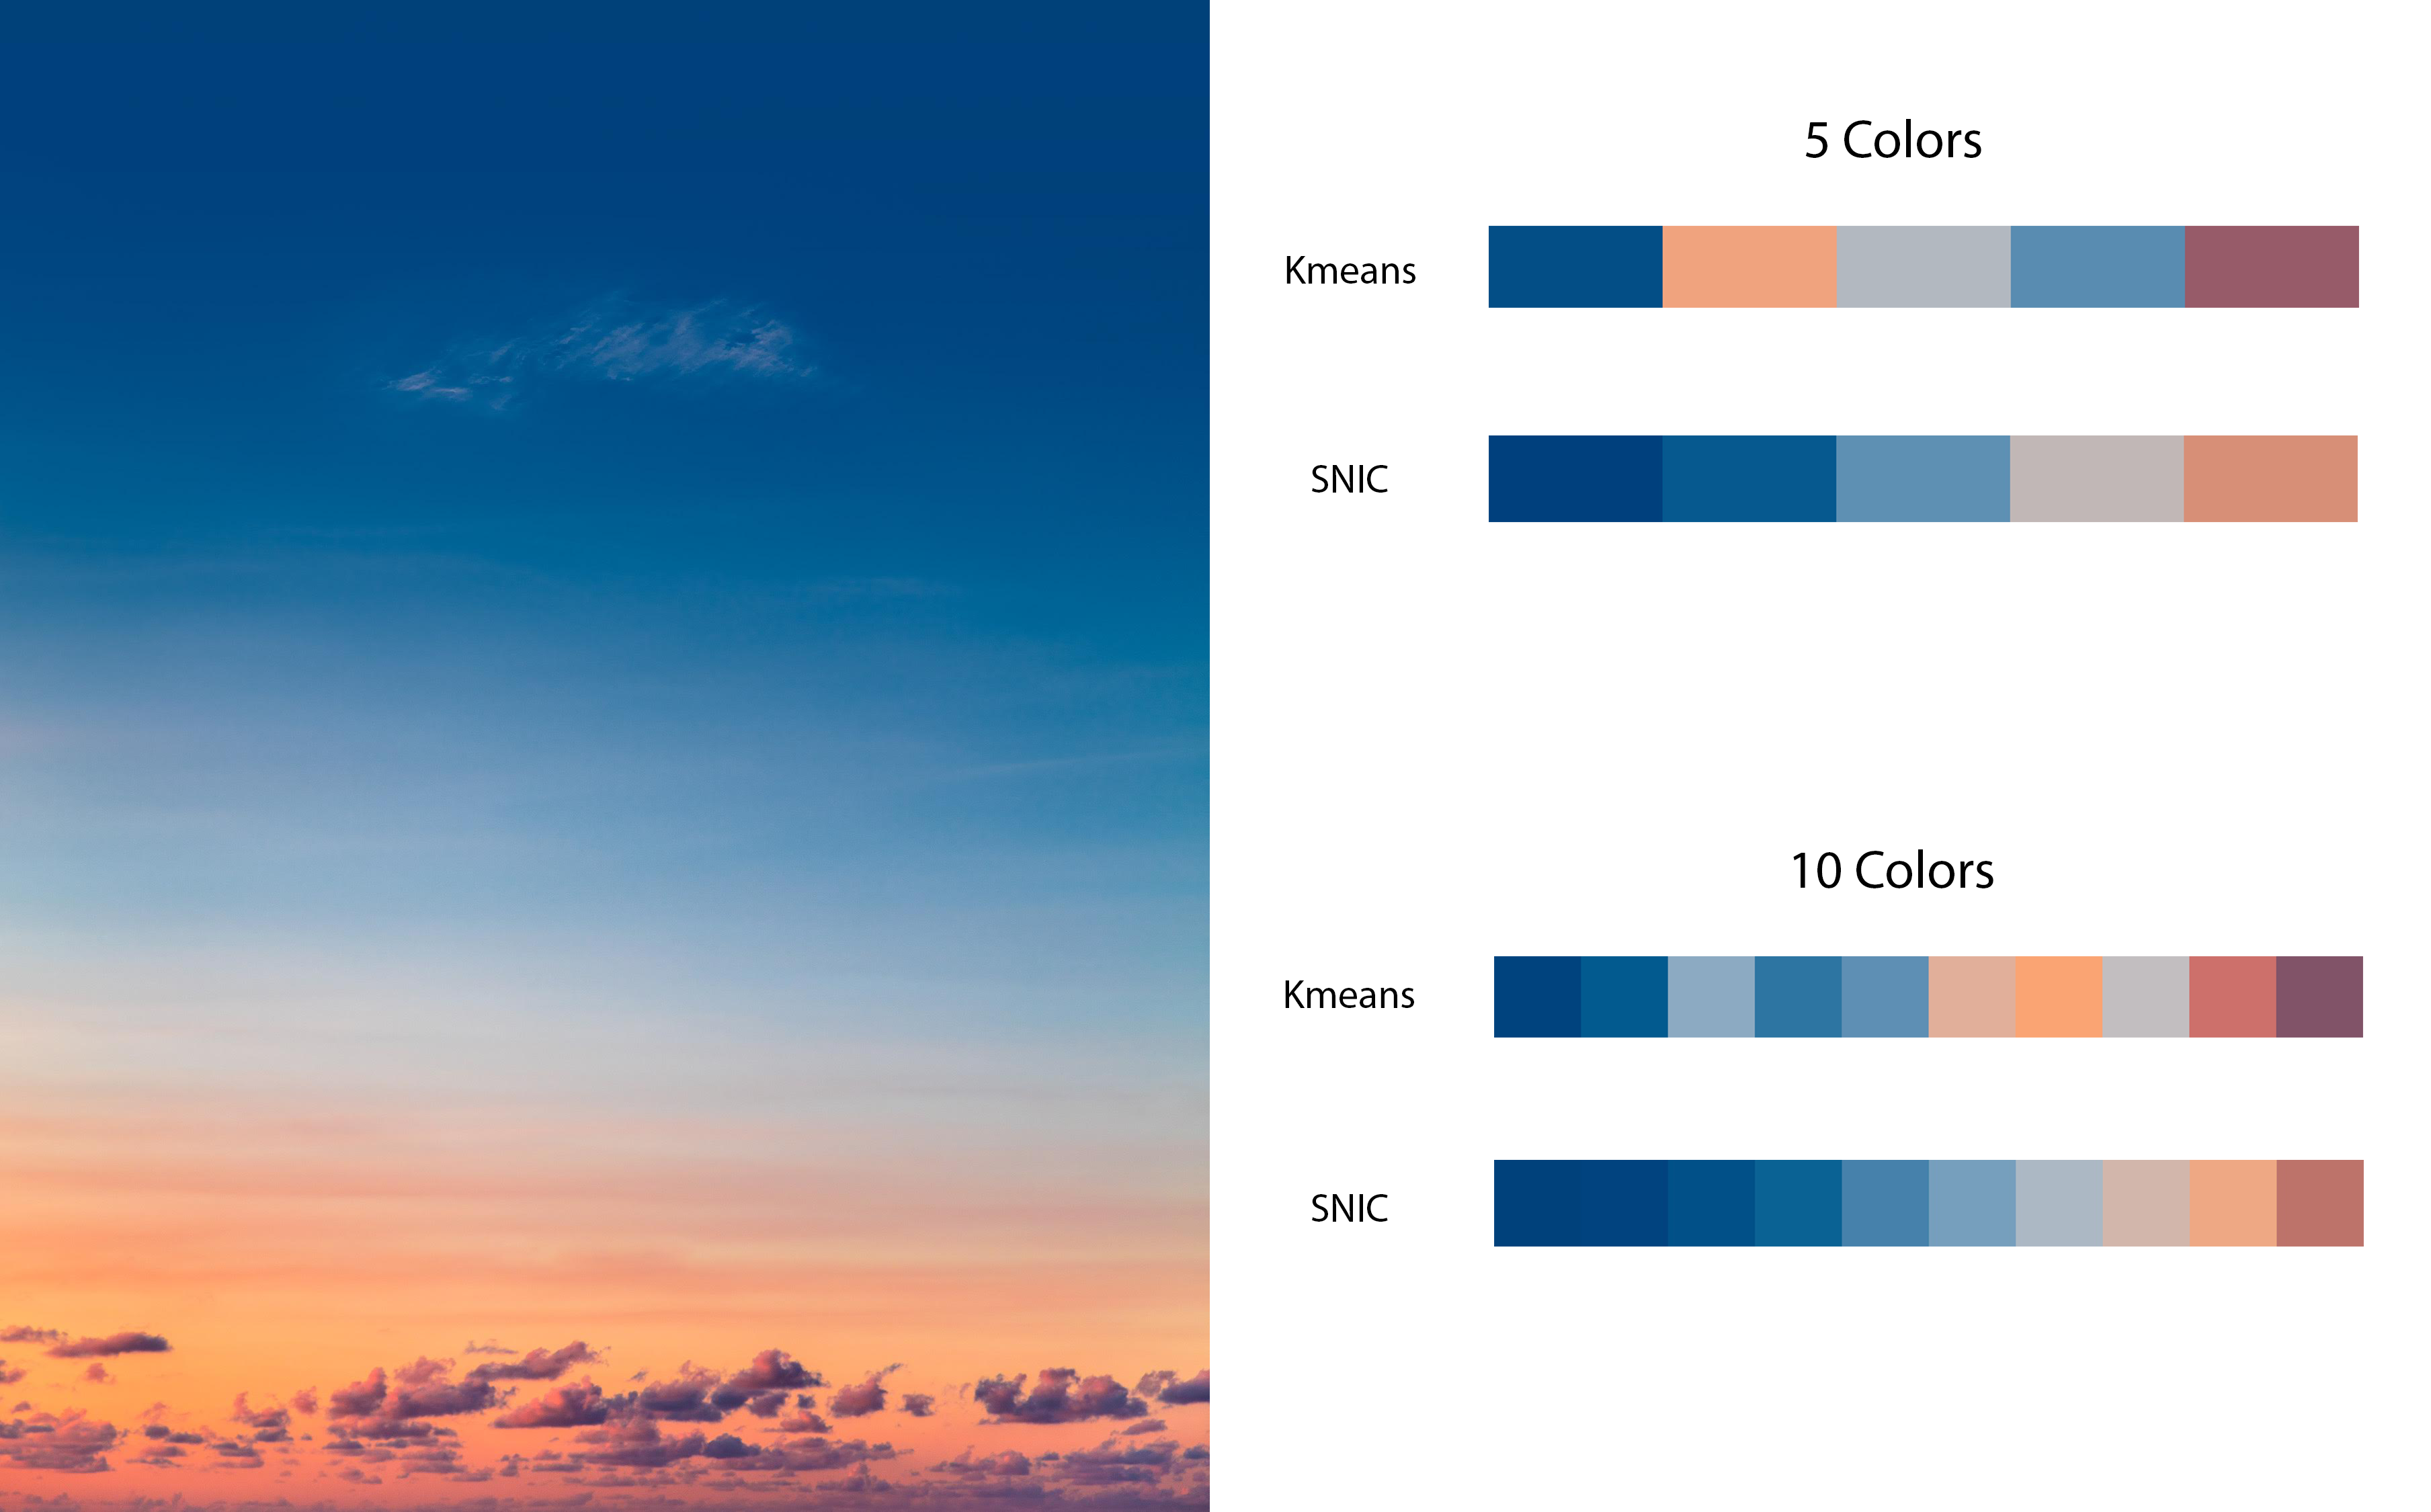
This is the result comparison of Kmeans (the algorithm I used in the last try) and SNIC. Now that the positional difference was considered, the colors seem to be more visually pleasing. However, if you see closely, you can see that Kmeans actually captured the representative colors better. While, the SNIC-produced colors seem to be more in harmony, there are some colors that SNIC could not catch while Kmeans could catch. Plus, SNIC works only when the sky image is vertically aligned.
After seeing the results, I started to think that maybe I should not segment the sky image. Though positional information would be great, the positional information cannot be applied to all sky images. Moreover, positional information may lead to ignoring the impressive color parts in the sky image. For instance, if there is more blue in the sky image, most of the colors in the palette would be blue. I needed to think of another way to capture the colors in the sky image.
Solutions?
After much thought, I started to see the problem from a different perspective. I was consumed with the idea of preserving the spatial information of the image, but it seemed useless. I looked at the 2D PCA decomposition again. If only I could capture the colors in the 2D PCA decomposition, I could make a beautiful palette.
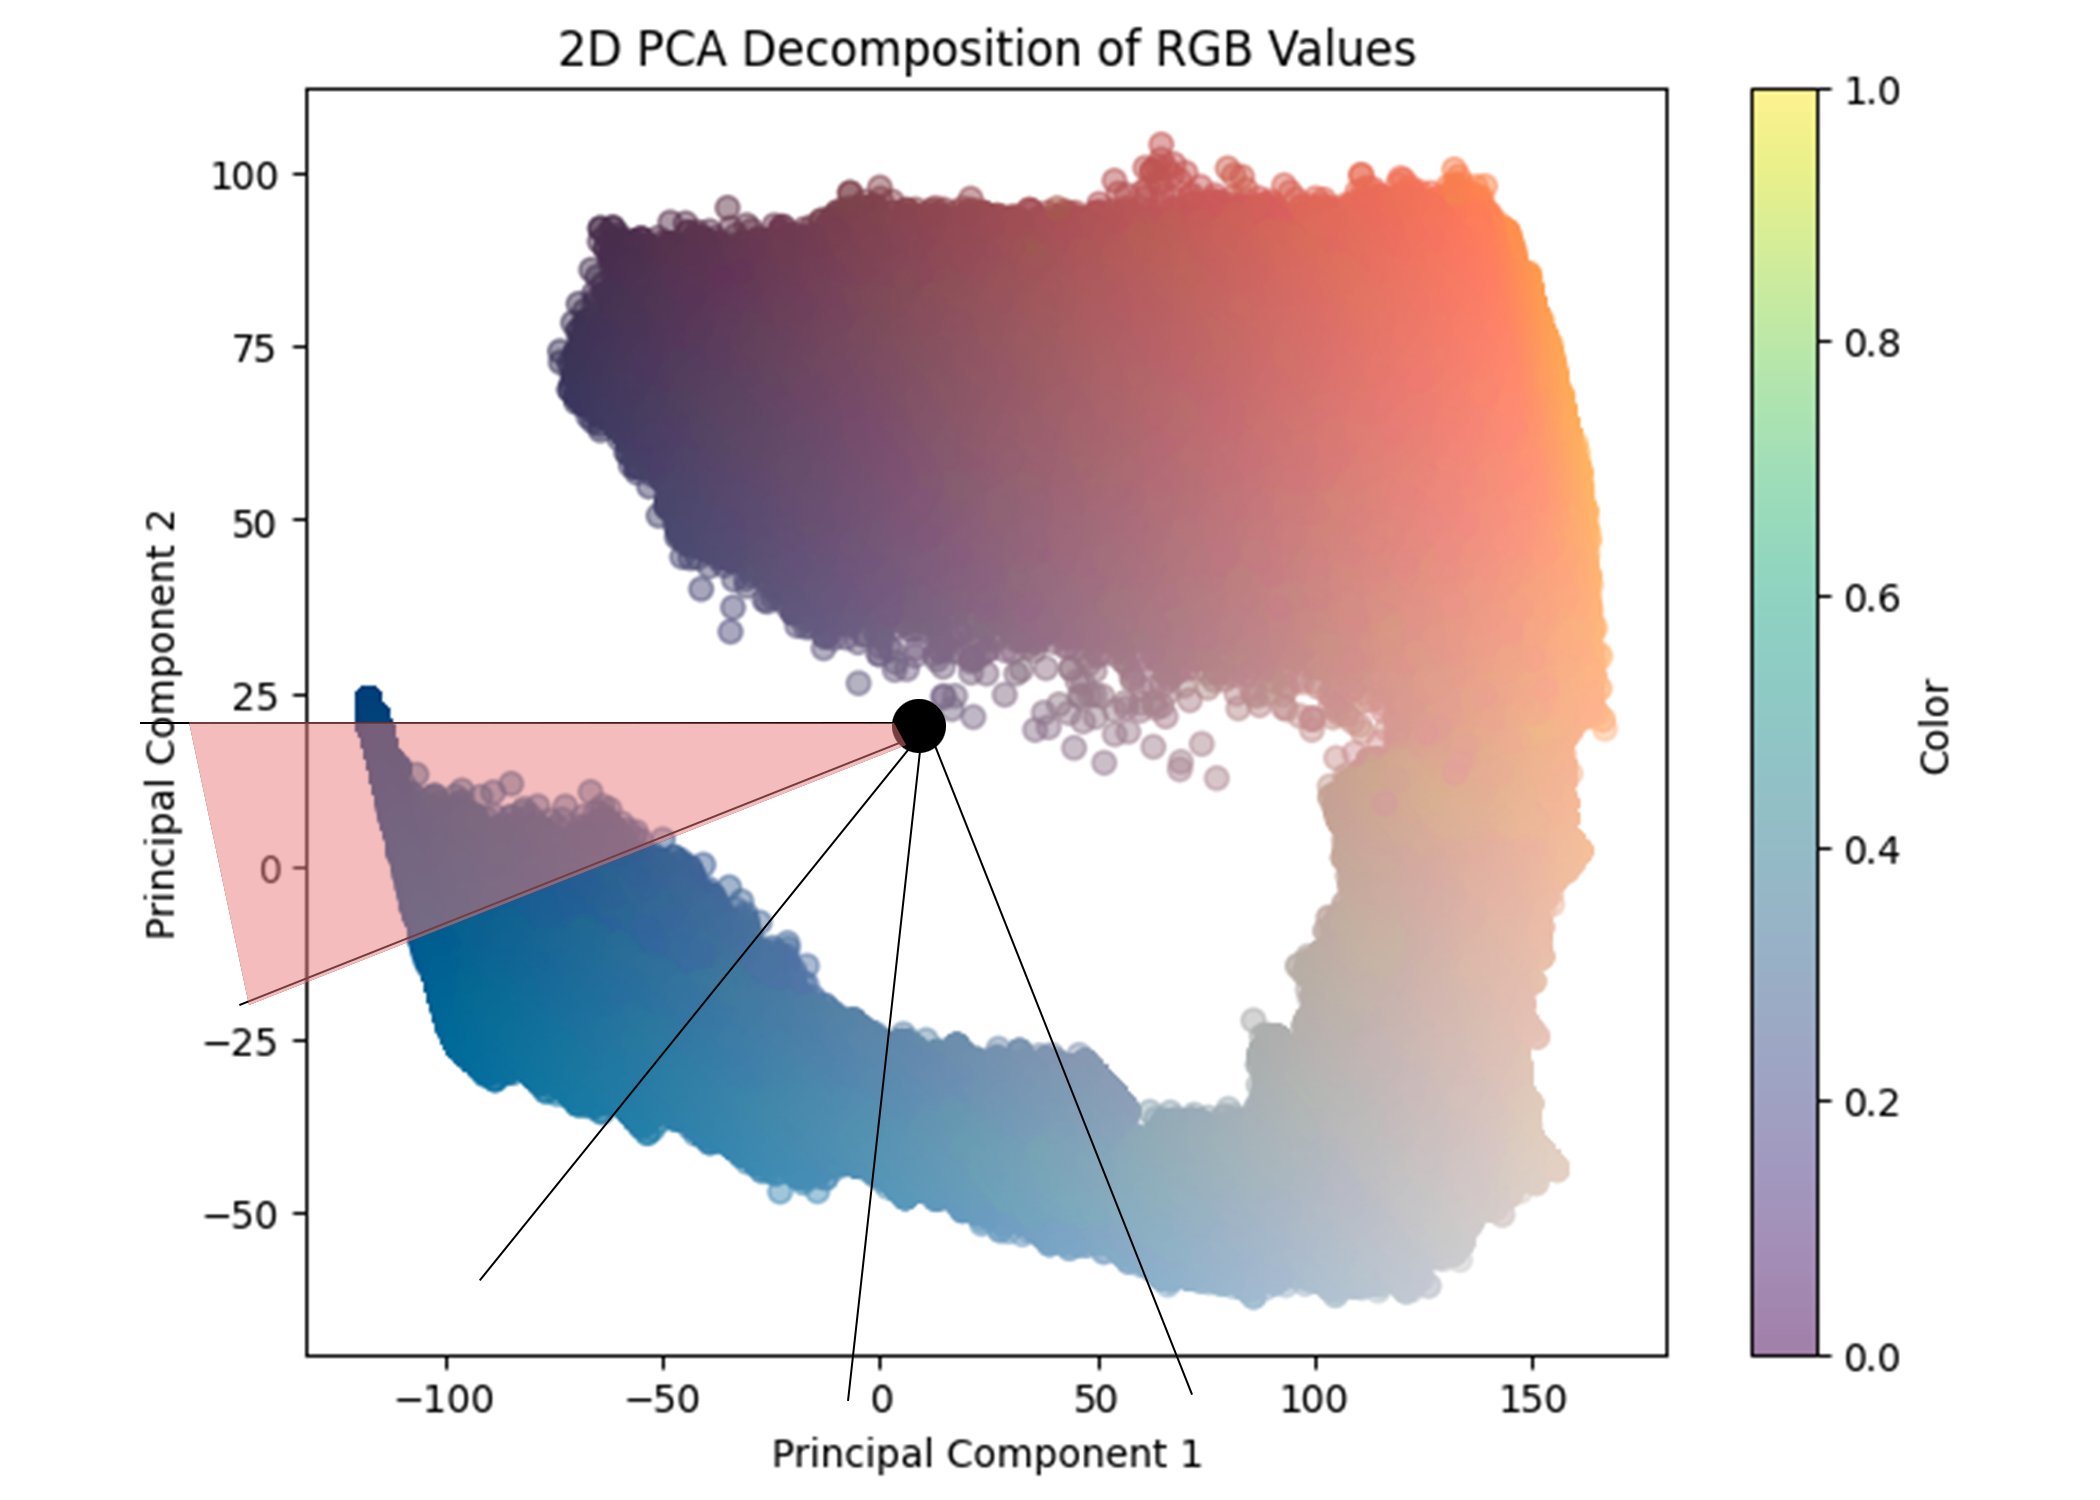
Then, I suddenly thought of a new way to group the images in the PCA. Why don't I group the colors in the PCA radially? Starting from the middle of the PCA, I could group the colors in the PCA radially. This would be great for capturing anomalies since the anomalies would be in the outer part of the PCA. I will try this method next time!
You can see my code for this project here.